📄 For general VS Code tips and tricks, visit the parent page of this one. If you are new to VS Code in general, I recommend checking it out.
🔗 Resource: the official docs on using Python with VSCode
- 💡 Python Settings Reference
Python and VSCode - Quick Start Guide
Pre-requisite: Having Python installed
- Install Visual Studio Code (aka VSCode)
- Install the Python extension pack for VSCode
- Open a project or file in VSCode that contains Python code, or create a new one
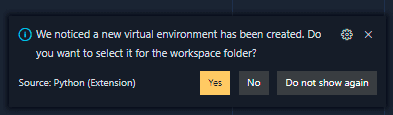
- Optional: Use a virtual environment and/or specific interpreter
- The Python extension will use a multi-step resolution process to look for a Python interpreter to use with your code.
- Most virtual environments it will detect automatically (such as
./venv, relative to your root workspace) -
- In the rare cases you might want to tell VSCode to use a different specific interpreter, you can do so via the
python.defaultInterpreterPathsetting, GUI, orCommand Palette -> Python: Select Interpreter
That should cover everything you need to get a basic Python editing experience up and running in VSCode, but some more advanced features are broken out further in sections below, such as:
Debugging Python in VS Code
If you wish to debug Python inside VSCode, debugpy is the recommended way to go; AFAIK, it is the only mainstream Python debugger that supports the Debug Adapter Protocol (DAP), which is how the debugger communicates with VSCode (as well as other IDEs).
debugpy with VSCode - General Concepts
📘 Official Resource: Python Debugging in VS Code and Debugging in Visual Studio Code
Unlike nodejs debugging with VSCode which support auto-attach and doesn't require extra dependencies, setting debugpy up with VSCode can involve some manual steps. It largely depends on what you are trying to debug.
For each of the debugging options below, here are some common things that will be referenced:
- Command Palette: A quick command selector / executor, brought up with
CTRL + SHIFT + P(CMD + SHIFT + Pon macOS), or viaView -> Command Palette - launch.json: A special file (stored at
.vscode/launch.json) which can be used to store debugging configurations - Run View: AKA the run and debug sidepanel, this is what you will have open while debugging, and it does things like show you a summary of active breakpoints, watch certain values, inspect the call stack, etc. It will open automatically when running a debug task, but you can also manually open it at any time.
- Debug Console: Once you have an active debugging session active, you can use the debug console as a live interactive REPL.
Anytime I mention using debugpy from the command line or from Python code, that means you need to already have installed debugpy into your environment (e.g. with pip install debugpy).
For learning how to do things like set breakpoints in VSCode (including conditional breakpoints!) and using the debug panels, refer to the official docs.
Single File Debugging
Singe-file python debugging is by far the most straightforward. This refers to starting the debugging session by executing a single file as the entry point, not necessarily just debugging a single file at a time.
Your options to start the debugging session from a single-file entry point are:
Command Palette->Python: Debug Python FileRun -> Start Debuggingor simplyF5on your keyboard- debugpy CLI: Refer to below section on configuration-based debugging
Note: Single file debugging will sometimes not let you use breakpoints in other files, even if those files are imported and executed in the file you are debugging.
Configuration Based Debugging with Python in VS Code
For pretty much anything beyond single-file debugging in VS Code, you have to set up some sort of configuration in launch.json, mainly because VSCode has to know which port to listen for messages from the debugger on.
🤔For some reason, VS Code has not released an auto-attach feature for Python like it has for NodeJS. If you are interested in this, subscribe to issue #1182.
Luckily, VS Code has presets for most debugging scenarios, and can walk you through setting up a configuration (⁕). To scaffold a new configuration, any of the following can be used:
Run->Add ConfigurationCommand Palette->Debug: Select and Start Debugging->Add Configuration- Create
launch.json(e.g.mkdir -p .vscode && echo "{}" > .vscode/launch.json), then open the file, and clickAdd Configuration...button that appears
When you do any of the above, VS Code should walk you through picking a preset.
🚨 I would almost always recommend deleting the
pathMappingssection; it almost never works out-of-the-box in my experience and ends up breaking things like breakpoints
⁕ = There are some edge-cases with this, primarily for things like Django or python sub-processes. For details, see sections below.
If you want to debug libraries (e.g., code within
{YOUR_VENV}/lib/python3.x/site-packages, etc.), make sure you havejustMyCodeset to false
Invoking debugpy via Python Code
💡 The neat thing about invoking debugpy via code is that you don't have to change how you launch your application at all and you can start or stop debugging at any point, without having to reload your app! 🤯
The steps for invoking debugpy via Python code actually looks rather similar to the CLI step below; you still have to create a corresponding launch.json file and the CLI arguments are translated to Python methods.
For example, instead of this CLI command:
python -m debugpy --listen 5678 --wait-for-client ./my_python_entrypoint.pyYou could use this python code, in my_python_entrypoint.py:
import debugpy

debugpy.listen(5678)
debugpy.wait_for_client()
Show / Hide launch.json config
{
	"version": "0.2.0",
	"configurations": [
		// Based on the `Python: Remote Attach` preset
		{
			"name": "Python: Remote Attach",
			"type": "debugpy",
			"request": "attach",
			"connect": {
				"host": "localhost",
				"port": 5678
			},
			"justMyCode": true
		}
	]
}
Note:
"type": "python"in launch.json has been deprecated; use"type": "debugpy"instead.
The debugpy library also offers debugpy.breakpoint() for setting a breakpoint via code.
Invoking debugpy via CLI
If you want to use the debugpy CLI with VS Code debugging, you will want to mainly follow the debugpy CLI docs - the only special thing is that you need to create a corresponding launch.json configuration first:
- Use the
Python: Remote Attachpreset - The
portnumber you pick (e.g.5678) doesn't really matter, except it must be the same port you pass to the debugpy--listenargument - If the part of your code that you need to debug will be reached faster than you can open the debug view in VS Code (or hit
F5), use the--wait-for-clientoption with debugpy- This will pause your Python code until debugpy detects that the VS Code debugger hsa attached itself (via port communication) to the debugpy adapter
Show / Hide debugpy CLI VS Code Setup
Step 1: Create a launch.json entry:
{
	"version": "0.2.0",
	"configurations": [
		// Based on the `Python: Remote Attach` preset
		{
			"name": "Python: Remote Attach",
			"type": "debugpy",
			"request": "attach",
			"connect": {
				"host": "localhost",
				"port": 5678
			},
			"justMyCode": true
		}
	]
}
Note:
"type": "python"in launch.json has been deprecated; use"type": "debugpy"instead.
In general, you can (and should) remove the
pathMappingsetting that the preset includes, unless you are debugging across a remote connection (not your local PC)
Step 2: Run my program via debugpy
Notice that I'm using the same
portas specified inlaunch.json, and--wait-for-clientto give VS Code time to attach before executing my Python
python -m debugpy --listen 5678 --wait-for-client ./my_python_entrypoint.pyStep 3: Tell VS Code to use my config to attach to debugpy
- If my config is already selected as the active launch config, or I only have one config, I can just hit
F5orDebug: Start Debugging - Otherwise,
Command Palette->Select and Start Debugging, or select the configuration via the Run and Debug panel selector and hit the start button.
Using debugpy with Django
There is a Django launch.json configuration preset that you can use to start manage.py; this should cover most use-cases.
However, in the case that you start Django via something else (e.g. a bash script), you might be looking for alternative approaches. Where this gets tricky is that the auto-reloading feature of Django will break the debugging connection (and hijack ports) if you stick debugpy.listen() in the wrong spot.
If you get error messages about Address already in use or timeouts connecting, that can be a sign that your debugpy setup code is getting invoked more than once, likely caused by Django reloading
For a code-based debugpy setup with Django that will work with auto-reloading, the easiest place to stick the debugpy setup code is in {YOUR_PROJECT}/wsgi.py. Or, any other entry-point hook listed in the answers to this StackOveflow.
If you are trying to debug migration files, you will probably want to wrap your debugpy listener in an if statement that only starts the listener if called via the manage.py CLI, so it doesn't get triggered by the Django auto-reloader:
import sys
import debugpy

if "makemigrations" in sys.argv or "migrate" in sys.argv:
	debugpy.listen(5678)
	debugpy.wait_for_client()
Using debugpy with pytest
If you are looking for a code-based approach, a startup hook you can wrap your debugpy setup code is pytest_sessionstart in conftest.py:
import debugpy

def pytest_sessionstart(session):
	debugpy.listen(5678)
	# Optional, if you want to not start tests until debugger is connected
	debugpy.wait_for_client()
	# ...
Using debugpy with Docker containers and remote hosts
As long as you have made the debugpy port for the container (or remote host) you want to debug the code inside of reachable from your local machine (e.g. via port-binding with Docker), debugging Python from a container or remote host should generally work the same as any other scenario, with one important difference: you almost always need to configure the pathMappings setting, to tell the debugger system how the paths within the Docker container (or other remote host) should be mapped back to your local source code files.
E.g., if my local source code that I'm debugging is under ./src/my-app, but within the container I have this code mounted at /opt/app/deploy, I might need something like this:
{
	"pathMappings": [
		{
			"localRoot": "${workspaceFolder}/src/my-app",
			"remoteRoot": "/opt/app/deploy"
		}
	]
}
If you are able to connect to debugpy, but none of your breakpoints are being hit, an incorrect or missing
pathMappingsis likely your issue
Enabling Debugger Log Files
You can enable saving the debugpy log to a file by tweaking your launch.json file, or using debugpy.configure.
launch.json
{
	"configurations": [
		{
			"name": "Python Debug",
			"logToFile": true,
			// [...]
		}
	]
}
If you enable logging only through
launch.json, the logs will appear in the VSCode extensions directory, instead of within your project directory. To specify a different log directory, set theDEBUGPY_LOG_DIRenvironment variable to the desired full path.
Python
import debugpy

debugpy.log_to('/Users/Joshua/debugpy-logs')
⚠ For both
log_toandDEBUGPY_LOG_DIRI recommend using a full path - so/Users/Joshua/logsinstead of~/Joshua/logs, or./logs.
💡 For more details, check out debugpy's docs: "Enabling Debugger Logs"
Python Linting in VSCode
Python Linting Setup / Extensions
As of writing this, in January 2024, VS Code has moved from having bundled Python linting tooling, to asking users to instead install individual extensions for the linters they want to use.
For example, the ruff extension contributes both linting and formatting tooling to VS Code and is controlled by ruff.* settings.
For more detailed instructions, see the official linting setup docs.
Python Linting in VSCode - Legacy / Deprecated Linting Setup
🚨 THIS SECTION IS FOR LEGACY SUPPORT: VS Code is currently overhauling the way Python formatters and linters are integrated into the IDE; they are moving from having linters and linters settings bundled together, and instead moving to individual extensions and per-extension settings. You can read more about this here ("Deprecated Built-in Linting and Formatting Features").
In short, this means that users need to switch from using bundled tooling and
python.linting.*settings, to installing individual extensions and controlling them via their associated settings.Since there is a transition period, and some users might still find the old settings and reference material useful, I'm keeping this part of my guide around for a bit longer before I will remove it. But for modern VS Code users, please ignore this section.
📘 Official Resource: Linting Python in Visual Studio Code
Visual Studio Code offers a large number of Python linting options, which include (at the moment):
banditflake8mypyprospectorpycodestylepydocstylepylamapylint
To pick a linter to use with your project, use Command Prompt -> Python: Select Linter. Picking a linter will automatically change some corresponding settings in .vscode/settings.json.
Note: The linter either needs to be installed in the same environment as the Python interpreter used with VS Code, or passed via
python.linting.{LINTER_NAME}Path: "". The Python extension will detect if the linter is not installed after selecting it, and will offer a one-click install button for convenience!
To configure your linter of choice beyond its defaults, most linters expose additional settings via python.linting.{LINTER_NAME}Args: [], and to customize these, you should refer to the CLI reference for your given linter.
For example, to tell PyCodeStyle to enforce a line-length limit:
{
	"python.linting.enabled": true,
	"python.linting.pycodestyleEnabled": true,
	"python.linting.pycodestyleArgs": [
		"--max-line-length",
		"79"
	]
}
Django Linting in VSCode
The extra consideration for linting Django code with VS Code is if you are using pylint with the pylint_django plugin. In that case, you will likely find the following settings helpful:
{
	"python.linting.enabled": true,
	"python.linting.pylintEnabled": true,
	"python.linting.pylintArgs": [
		"--load-plugins",
		"pylint_django",
		"--django-settings-module=myproject.settings"
	]
}
Troubleshooting Python Linting in VSCode
Check the Output -> Python logs.
If linting does not seem to be doing anything / exposing errors, even if it is enabled, check to make sure the path is set up correctly. Some linters (such as flake8) don't seem to work well if the path is set to somewhere outside of the current project.
Python Types in VSCode
The official Python extension comes bundled with a Pylance extension, which will be auto-installed and activated along with the main extension. This Pylance extension unlocks rich IntelliSense and type-checking features, powered by Microsoft's Pyright (a static type-checker for Python).
🚨 ⚠ The default mode for pylance, as far as in-IDE checking and warning, is off! To get warnings in VS Code for mis-matched types, or even just basic inference, change
python.analysis.typeCheckingModeto"basic"or"strict".
Although this works out-of-the-box for the majority of projects (after turning on checking), here are a few special things to note:
- The Pylance extension comes bundled with some type stubs, for common libraries (see notes in README), such as
matplotlib,pandas, anddjango- Warning: VSCode will not warn if you Pylance is using type stubs that do not match the version of the library your project has installed. For example, your project might be using Django
v2.x, but the bundle type stubs are for Djangov3.x.- It might also make it misleading as to which libraries are built-in; for example, it will provide stubs for
yaml.*methods if you doimport yaml, even if you don't havePyYAMLinstalled - It is usually better to explicitly install and use type stubs for your specific project, rather than the defaults
- It might also make it misleading as to which libraries are built-in; for example, it will provide stubs for
- Warning: VSCode will not warn if you Pylance is using type stubs that do not match the version of the library your project has installed. For example, your project might be using Django
- You can use
Go to Type Definitionto see where / how VSCode is sourcing the type for a specific variable, method, etc. - The Pylance extension is configurable
- You can always install your own stubs (and this is usually recommended)
Conflicting Type Stubs
If you have installed Python type stubs for packages you are using, but the VS Code Python extension pack has bundled a different version of the same stub package, you can run into an issue where they conflict with each other.
If there is a conflict, in order to get your version to "win" and be the types that are pulled in for intellisense and type-analysis, you have to manually include the types in your extraPaths setting (this has to do with the order used for type resolution).
Formatting Python in VS Code
Python Formatting Setup / Extensions
In an almost identical fashion to setting up Python linting in VS Code, for integrated formatting of Python in VS Code you now need to install whatever formatter you want to use as an extension.
For example, the ruff extension contributes both linting and formatting tooling to VS Code and is controlled by ruff.* settings.
For a more detailed guide, refer to the official VS Code Python formatting instructions
Formatting Python in VS Code - Legacy / Deprecated Formatting and Linting Settings
🚨 THIS SECTION IS FOR LEGACY SUPPORT: VS Code is currently overhauling the way Python formatters and linters are integrated into the IDE; they are moving from having formatters and formatter settings bundled together, and instead moving to individual extensions and per-extension settings. You can read more about this here ("Deprecated Built-in Linting and Formatting Features").
In short, this means that users need to switch from using bundled tooling and
python.formatting.*settings, to installing individual extensions and controlling them via their associated settings.Since there is a transition period, and some users might still find the old settings and reference material useful, I'm keeping this part of my guide around for a bit longer before I will remove it. But for modern VS Code users, please ignore this section.
📘 Official Resources: Python Formatting Settings Reference and Formatting in VS Code Basics
The main way to enable the use of a Python formatter in VS Code is through .vscode/settings.json.:
{
	// Currently `autopep8`, `black` or `yapf`
	"python.formatting.provider": "autopep8"
}
Additional CLI args can be passed to the formatter of choice, through python.formatting.{FORMATTER_NAME}Args: [], and the path can be specified via python.formatting.{FORMATTER_NAME}Path: "" if you have it installed somewhere other than the current environment.
Here is an example of a more advanced configuration:
{
	"python.formatting.provider": "autopep8",
	"python.formatting.autopep8Args": [
		"--max-line-length",
		"79",
		"--experimental"
	],
	"[python]": {
		"editor.defaultFormatter": "ms-python.python",
		"editor.formatOnSave": true,
		"editor.codeActionsOnSave": {
			"source.organizeImports": true
		}
	}
}
Python Formatters in VSCode - Troubleshooting
In general, when something doesn't seem to be going right with a VSCode linting or formatting process, it is usually helpful to see that actual CLI commands that VSCode is invoking under the hood. You can do this by opening the
Outputpanel in VSCode and selectingPythonin the dropdown.
- VSCode's invocation of Black formats my code wrapping differently than if I just call
black {FILE}from the CLI! What gives?- When you call
blackfrom the CLI without specifying a value for--line-length, it defaults to88. However, VSCode will default it to79if you don't provide an override. - Fix: Explicitly set line length to the black default of
88, with--line-length 80as a blackArgs entry.
- When you call
- VSCode's invocation of Black (through
formatOnSaveor manually calling the formatter) does not fix incorrect quote style (single vs double), but calling black via CLI does- VS Code, by default, uses the
--skip-string-normalizationflag when invokingblack, which leaves quotes alone. You can override this by setting thepython.formatting.blackArgsvalue - to any value - even setting to an empty[]will prevent VSCode from using its default arguments
- VS Code, by default, uses the
Improving Python Auto-Imports in VSCode
Auto-import in this context refers to the feature in VS Code when you start typing out the name of something that needs to be imported, and VS Code automatically adds the
importstatement when you hitTABorENTER, or use the Quick Fix option to add the import
There are a few settings that can be used to improve the behavior of automatic Python imports in VS Code.
💡 For settings where you are passing in paths, you can use
${workspaceFolder}as a macro for the project root / workspace subdirectory root
python.analysis.autoImportCompletions
Given the name, it makes sense you would want this to be set to true
python.analysis.extraPaths: []
- This is setting exposed by the Pylance extension, which lets you tell it about extra paths for use with import resolution
- If you are running into issues with VS Code saying that imports could not be resolved, or adding extra directories (e.g. it auto-fills with
dirA.dirB.my_importinstead ofdirB.my_import), this can fix it - You can also use this to get auto-complete for deeply nested imports that don't work out of the box
- This replaced
python.autoComplete.extraPaths(mentioning in case you see this in any configs)
python.analysis.packageIndexDepths
When working with libraries where you have really deep module imports, which is actually fairly common with things like Django and sqlalchemy, it is often useful to tweak this setting so you get auto-complete for submodules. By default, pylance does not index very deeply into packages.
For example, here is an adjustment just for Django and Django Rest Framework:
{
  "python.analysis.packageIndexDepths": [
    {
      "name": "django",
      "depth": 10,
      "includeAllSymbols": true
    },
    {
      "name": "rest_framework",
      "depth": 10,
      "includeAllSymbols": true
    }
  ]
}
You can also tweak the indexing depth for all packages at the same time, but keep in mind that this will incur a performance penalty and might cause VS Code longer to start up or reindex when packages change:
{
  "python.analysis.packageIndexDepths": [
    {
      "name": "",
      "depth": 10,
      "includeAllSymbols": true
    }
  ]
}
pythonDiscoveryModule
In a few very rare cases (if I remember correctly, they were complex multi-root workspaces), I've had to use the following settings to get some import resolution stuff and interpreter paths working correctly:
{
	"python.experiments.enabled": true,
	"python.experiments.optInto": [
		"pythonDiscoveryModule"
	]
}
Django Editing in VSCode
For the most part, editing a Django project in VSCode works just like editing any other Python project. But, there are a few areas worth calling out - these are links to Django specific sections within this same guide:
Multi-Root Workspaces
A lot of issues and edge-cases with working on Python projects in VSCode can be traced back to how Python projects are organized versus how VSCode typically parses a directory. And issues with paths in general.
It's not a-typical for a Python project to involve multiple subdirectories with nested packages, and sometimes even multiple virtual environments and python interpreters. Out-of-the-box, VSCode tends to falter in these situations, that is, until you break out multi-root workspaces.
📘 Official Docs: Multi-root Workspaces
Here is an example of a multi-workspace config (keep in mind, they can get a lot more complicated than this):
{
	"folders": [
		{
			"path": "../flask-api"
		},
		{
			// Name is optional
			"name": "Django-powered Admin Portal",
			"path": "../django-admin"
		}
	],
	"settings": {
		"python.defaultInterpreterPath": "${workspaceFolder}/env/bin/python3"
	}
}
Note that some settings can be shared across all root directories, while others should be configured in a .vscode/settings.json file nested within the individual roots. For details, refer to the official docs.